We have identified three steps in mean global temperatures since 1970: one in 1979, one in 1988 and one in 1998. These three steps alone conspicuously and remarkably contain the entire modern era ‘global warming’ observed to occur between the late 70s and the early 00s, a period of about 20-25 years, depending on how you look at it. This means that outside these three distinct and sudden upward jolts, there has been no discernable ‘global warming’ going on at all for the duration of at least the last 50 years.
So how, then, did these three prominent steps in global temperatures come about?
It has long been known that the climate regime (the general state, arrangement and operative processes of the coupled ocean/atmosphere condition) of the Pan-Pacific basin changed fundamentally and abruptly in 1976/77. Many studies have documented this. Something big happened in the Pacific Ocean that year. This ‘thing’ has been dubbed ‘The Great Pacific Climate Shift’ (GPCS).
(At least) three major changes took place within this short period of time:
- The SOI (Soutern Oscillation Index) fell from a relatively high mean level to a relatively low mean level.
- The evolution of ENSO (El Niño, Southern Oscillation) events changed from a general westward-propagating to a general eastward-propagating sequence.
- The PDO (Pacific Decadal Oscillation) or, rather, the PDV (Pacific Decadal Variability)/IPO (Interdecadal Pacific Oscillation) switched from a negative (‘cool’) phase to a positive (‘warm’) phase.
In this post I will focus on points 1. and 3., not so much on point 2. Point 2. is also highly significant, though, and I will briefly explain it in the following. It is mentioned in the SAR (1996) of the IPCC, p164:
“Wang (1995) found that the characteristics of the onset of the Pacific-wide warming associated with an El Niño changed after the mid-1970s. Indeed, there appears to have been a rather distinct change in ENSO in 1976/77 (…).”
Trenberth et al. 2002 found the same thing:
”An important factor to be recognized in the evolution of SST patterns with ENSO and its changes over time is the 1976-1977 climate shift of ENSO activity toward more warm phases after about 1976 (…), which is very unusual given the record of the previous 100 years (…), and has been linked to decadal changes in climate throughout the Pacific basin and to changes in evolution of ENSO (…) Before 1976, ENSO events began along the west coast of South America and developed westward. In contrast, after 1977 the warming developed from the west, so that the evolution of ENSO events changed abruptly about 1976/1977 (…).”
And:
”(…) the climate shift in 1976/1977 seems to have been a major factor in fundamentally altering the evolution sequence of ENSO events. This suggests that the subsurface ocean evolution since 1980, which has become the paradigm for ENSO, may not be robust across all events and/or that the links between the subsurface and the surface may have changed. Mechanisms for warming in the tropical Pacific depend on a balance of terms within the ocean (…), and this balance may have shifted. For instance, vertical temperature gradients and upwelling in the eastern tropical Pacific play a key role in westward development, while eastward development relies more on east-west temperature gradients and advection in the central tropical Pacific.”
So, a big ‘regime shift’ in Pacific climate indeed occurred in 1976/77.
Hare and Mantua (the original ‘discoverers’ of the PDO) provide a definition of how to detect and describe a climate ‘regime’ and a climate ‘regime shift‘ in their paper from 2000, “Empirical evidence for North Pacific regime shifts in 1977 and 1989.” It is very much worth noting, especially for those people who insist that sudden shifts in mean temperature levels (like the ones we have identified) is simply explained by random fluctuations around a perceived (postulated) rising ‘background trend’:
“There is no common definition of a regime shift, but certain aspects are generally agreed upon. A regime implies a characteristic behavior of a natural phenomenon (sea level pressure, recruitment, etc.) over time. A shift suggests an abrupt change, in relation to the duration of a regime, from one characteristic behavior to another. Although climate variability occurs across a broad spectrum of spatial and temporal scales, in the context of the current discussion a regime spans a decade or more, whereas a shift occurs within a year or so. There is also an important distinction between regime shift and random walk type variability. In a random walk model of climate variability, which involves gradual random change over time, there is no mean (average) state and, in the absence of negative feedback, variance increases with time.“
Lots has been written about the changes occurring across the shift of 1976/77. The most fundamental (and, perhaps, the decisive) one is the drop in SOI, the first point above. The Southern Oscillation (the -SO in ENSO) describes the variation in the pressure difference between the more or less constant high pressure of the eastern tropical/subtropical Pacific and the more or less constant low pressure of the western tropical Pacific. This pressure differential is what drives the trade winds, normally blowing from east to west across the vast tropical basin of the Pacific Ocean. It is set up by a large-scale coupled ocean/atmosphere feedback loop process whereby the trades push warm water to the west, inducing high rates of moist deep convection, whose strong upward air currents lead to low surface pressures, in turn sucking in more winds from the east. The resultant distinct surface temperature gradient from east to west across the tropical Pacific maintains the accompanying pressure gradient, in turn securing the trade winds keeping up the work pushing warm water to the west, thereby preserving the original temperature gradient. It’s a chicken-and-egg situation. Everything causes everything else. Except the two external factors driving the whole process: the Sun’s energy input and Earth’s rotation.
Why is the drop in SOI significant? It signifies a flattening of the tropical Pacific thermocline. Thus, it most likely effectuated both of the other points (2 and 3) above.
What is the thermocline? A very general definition is given by wikipedia:
“In the ocean, the thermocline may be thought of as an invisible blanket which separates the upper mixed layer from the calm deep water below. Depending largely on season, latitude and turbulent mixing by wind, thermoclines may be a semi-permanent feature of the body of water in which they occur or they may form temporarily in response to phenomena such as the radiative heating/cooling of surface water during the day/night. Factors that affect the depth and thickness of a thermocline include seasonal weather variations, latitude and local environmental conditions, such as tides and currents.”
In the tropical Pacific basin, the thermocline is a fairly permanent feature, but its depth in the different parts of the basin is firmly connected to the loop described above. When the pressure difference from east to west is large (high-value SOI), the trades blow strongly and the (solar-heated) warm water is more effectively pushed from the east to the west. This increases the temperature gradient. The east gets cooler than usual, the west gets warmer than usual. This situation is basically the La Niña condition.
And the greater the east-west temperature gradient, the steeper the thermocline:

Figure 1.
The steepness of the tropical thermocline thus has a direct bearing on the distribution of warm water in the Pacific, on how efficiently the solar-heated water is brought from the east and stored in the west.
Here is what happened to the mean east-west pressure differential (SOI) in the tropical Pacific in 1976/77:

Figure 2.
The interesting thing is what this abrupt change led to. Stephens, Levitus et al. 2001 discuss the 1976/77 shift in light of this and how it affected the general temperature (energy) distribution in the Pacific basin:
“Abstract. The temporal variability of Pacific Ocean upper ocean heat content is examined for the 1948-1998 period using gridded, objectively analyzed temperature anomaly fields. Results indicate a “regime shift” in upper ocean temperature structure occurred in conjunction with the atmospheric shift in sea level pressure around 1975 leading to warming (cooling) in the eastern (western) equatorial Pacific. The shift is a basin-wide phenomenon affecting the thermal structure from 60°S to 70°N. EOF analysis of the Pacific Ocean heat content (0-125 m) shows a shift from a relatively cool to a warm state in the equatorial Pacific during the mid 1970s. Further analysis of the gridded temperature anomaly fields shows equatorial warming to be as much as 1.5°C and a cooling in the North Pacific of 1°C, down to 250 meters, after the mid-1970s. Overall, the analysis indicates the “regime shift” continues through 1998 with no signs of returning to a cooler phase.“
And here it is:
“The decrease (increase) of heat content in the western (eastern) tropical Pacific after the mid-1970s regime shift is consistent with a decrease in the east to west downward tilt of the tropical thermocline. Clarke and Lebedev (1997) estimated zonal wind stress as a function of year for the equatorial Pacific Ocean based on atmospheric sea level pressure differences (to avoid biases in winds from ship data). Their work shows a sudden decrease in the westward wind stress in the mid-1970s consistent with our results that show a decrease in the westward, downward tilt of the equatorial and tropical thermocline.”
The “sudden decrease in the westward wind stress in the mid-1970s” corresponds to the drop in SOI, tracking the pressure difference from east to west across the tropical/subtropical Pacific basin.
There are reasons to believe that the 1976/77 Pacific regime shift started in the tropics with the sudden drop in SOI, with direct and near-immediate atmospheric propagation to the northern and southern extratropics from there. There seems to be a general agreement that the changes in the North Pacific (PDO) at this time was just one regional expression of a synchronous shift in a Pan-Pacific climate regime pattern sometimes termed the PDV (Pacific Decadal Variability) or the IPO (Interdecadal Pacific Oscillation). Similar changes occurred both north and south of the equator, hinting at an ultimate tropical origin. From Evans et al. 2001:
“The temporal similarity of these proxies corroborates recent modeling and observational studies linking tropical and basin-scale phenomena in the Pacific. The approximate symmetry of the spatial pattern about the equator and the simultaneous coherence between northern and southern Hemisphere proxy observations suggest a tropically mediated mechanism. (…) Karspeck and Cane (2000) showed that a wind-driven tropical ocean model can reproduce a well-known feature of PDV, the 1976–77 decadal shift in thermocline depth anomaly.”
Once again the tropical thermocline shift, concomitant with the sudden drop in SOI.
We are getting closer now to what actually happened to global temperatures in 1979. It basically came at the end of – as ‘The Grand Finale’ to, so to say – a two to three-year period of change in Pacific temperature distribution following the original ocean/atmosphere shift in 1976/77.
The clue is the PDO (or again, in reality, the Pan-Pacific PDV/IPO) ‘phase shift’ from cool to warm (point 3 above). The PDO describes a specifc kind of SST pattern in the North Pacific. From wikipedia:
“During a “warm”, or “positive”, phase, the west Pacific becomes cool and part of the eastern ocean warms; during a “cool” or “negative” phase, the opposite pattern occurs.”

Figure 3.
As you can see, the PDO ‘positive’ pattern resembles the ENSO ‘positive’ pattern. Once again from Mantua & Hare, this time from a 2002 paper of theirs:
“The Pacific Decadal Oscillation (PDO) has been described by some as a long-lived El Niño-like pattern of Pacific climate variability, and by others as a blend of two sometimes independent modes having distinct spatial and temporal characteristics of North Pacific sea surface temperature (SST) variability. A growing body of evidence highlights a strong tendency for PDO impacts in the Southern Hemisphere, with important surface climate anomalies over the mid-latitude South Pacific Ocean, Australia and South America.“
Further:
“Climate records from around the Pacific Basin contain evidence for strong interannual to interdecadal variability, in special cases with remarkably large-scales (…) of spatial coherence (…). El Niño/Southern Oscillation (ENSO) has long been known to be the prominent source for hemispheric-scale interannual climate variations for the Pacific and the global tropics (…). In the last two decades of the 20th Century, the extratropical Pacific Ocean was in an almost continuous El Niño-like state despite the absence of tropical El Niño events in a majority of those years. This situation, which originated with a strongly anomalous winter in 1976–1977, has been termed a “climatic regime”, following a regime shift in 1977.“
This (the boldface section) is the key point.
What happened across the 1976/77 shift was simply this: The establishment of the positive phase of the PDO pattern (also extending to the southern hemisphere), whereby the mean temperature of the eastern Pacific basin as a whole warmed significantly. We can track this in the temperature data:

Figure 4. Using the East Pacific climatology of 1970-78, the SSTa evolution in the sector 65 N-60 S, 165 E-80W (East and Central Pacific) is displayed in six consecutive one-year segments (July to June). Notice the two tongues persistently jutting in from the left (from the West Pacific side) north and south of the tropical belt. They start out being relatively warm surrounded by wide regions of relatively cool surface water. But during the winter of 1976/77 this pattern flips abruptly – the PDO phase shift – and prevails even after the early El Niño following the initial La Niña.
What you will notice here, as we go from the deep La Niña of 1975/76 up through the medium El Niño of 1977-78 and on to the neutral to ‘positive neutral’ (warmish, but below the El Niño threshold) conditions playing out during the ensuing years, is simply the firm establishment of the classical ‘positive’ PDO SSTa pattern in the Eastern Pacific basin. What is most interesting about it is how the basin as a whole outside that narrow equatorial band warms relative to the NINO3.4 region (central rectangle), maybe a subtle point in the maps above, more readily seen here:
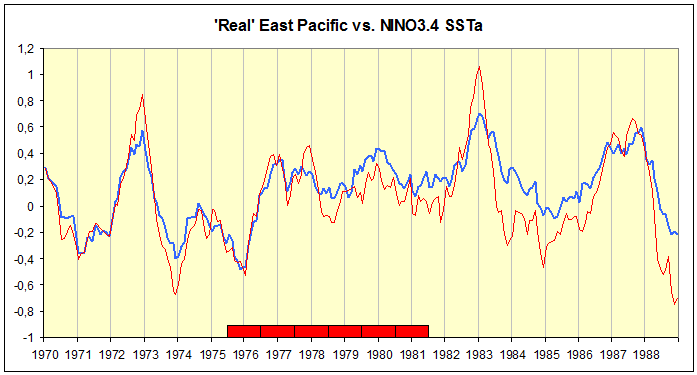
Figure 5. ‘Real’ East Pacific (blue) vs. NINO3.4 SSTa (red), downscaled /3.5. The six red one-year segments down on the x-axis correlate with the six maps above. Watch the conspicuous Real Pacific ‘lift’ away from the NINO3.4 occurring around 1978/79.
I use here the term ‘Real’ East Pacific. Let me explain it.
The ENSO process operates across the entire Pacific basin. NINO3.4 IS NOT ‘ENSO’! It basically works like a gigantic pendulum where solar-heated water swings (or, rather, sloshes) back and forth between the East and West Pacific. It’s not really an oscillation, because the swings are pretty uneven in amplitude and duration. But there is a very clear and consistent pattern of inverse response between the eastern and western ENSO sectors, which roughly, but not entirely, correspond to the East and West Pacific respectively. The rule of thumb is: When the East warms, the West cools, and when the East cools, the West warms. The currency here is the solar-heated water, carrying the energy from the Sun – unimaginably large amounts of it. This is roughly how it works, explained by Trenberth et al. in that previously referenced paper from 2002:
“The negative feedback between SST and surface fluxes can be interpreted as showing the importance of the discharge of heat during El Niño events and of the recharge of heat during La Niña events. Relatively clear skies in the central and eastern tropical Pacific allow solar radiation to enter the ocean, apparently offsetting the below normal SSTs, but the heat is carried away by Ekman drift, ocean currents, and adjustments through ocean Rossby and Kelvin waves, and the heat is stored in the western Pacific tropics. This is not simply a rearrangement of the ocean heat, but also a restoration of heat in the ocean. Similarly, during El Niño the loss of heat into the atmosphere, especially through evaporation, is a discharge of the heat content, and both contribute to the life cycle of ENSO.”
Most of the solar-heated water being thus brought in from the east to the west tropical Pacific ends up in that giant storage of solar energy called the West Pacific Warm Pool (WPWP), making up the central part of an extended similar region often termed the Indo-Pacific Warm Pool (IPWP). It is hard to put into words how massive this pool of warm water really is, how much energy is in fact stored here at any one time, and how all-important it is to the planet’s total energy budget. But it is big.
However, a significant portion of the energy does also get advected out from the warm pool to the extratropics of both the northern and southern hemispheres. The tropics basically vent their heat and keep the extratropics warm in the process. In the Pacific Ocean, this large-scale tropical-to-extratropical transportation process takes place in the western basin, not in the eastern. There’s a perfectly good reason for why that is: Earth’s rotation.
From this, one should be able to see that there are fundamental differences between the two ENSO sectors, the eastern and western basins of the Pacific. For one, the western basin is a warm water storage. The eastern basin is not. Also, in the East, the mean flow of air and water is in from the cool extratropics and then westward, out of the basin, once inside the tropics. In the West, that same flow comes in from the east, from the warm tropics, and then goes out to the cool extratropics. This general setup can be illustrated like this:

Figure 6.
Some of the water being drawn and pushed west across the tropical Pacific basin naturally spills north and south, deflected along the continental rim of Australasia (and some of it makes it through to the East Indian Ocean in the west). The rest is stored at depth in the giant West Pacific Warm Pool (WPWP, the small ellipse inside the bigger one, IPWP). Notice how, once you get outside the tropical zone, the circulation moves back east. So the eastern ENSO sector, the blue slice to the right, throws a tropical ‘cool wedge’ west towards the warm pool. This is where the NINO3.4 region is situated (the light green rectangle along the equator). And the western ENSO sector, the red slice to the left, in turn sends two extratropical ‘warm tongues’ (the ones we noted in the maps in Figure 4) back into the east. These go by the general designation of KOE (Kuroshio-Oyashio Extension) in the northern hemisphere and SPCZ (South Pacific Convergence Zone) in the southern.
This is how I prefer to divide the Pacific Ocean when examining the data of its two ‘pendular’ (in general, inversely related) basins, simply because if you simply split it down along the date line, you include broad regions into the one basin that ‘ocean process’-wise in fact belong rather to the opposite basin.
So my ‘Real’ East Pacific (or ‘Real’ ENSO East) is the blue sector you see in Figure 6. Likewise, the red sector is my ‘Real’ West Pacific-East Indian Ocean (or ‘Real’ ENSO West).
Recalling my rule of thumb about the inverse relation between the two basins of the Pacific Ocean, that when the East cools, the West normally warms, and the other way around, take a look at this modified world map:

Figure 7.
It shows the two ENSO sectors and the change in SST anomalies between 1983/84 and 2011/12, two similar ENSO years (I’ve erased the rest of the world to avoid distraction from this particular region). Notice how the WPWP and the two extratropical tongues of the West, protruding into the east, together make up a vast ‘Warm Horseshoe’ embracing the ‘Cool Wedge’ of the East. We will most definitely get back to this very peculiar SSTa change pattern upon addressing Steps 2 and 3. (Don’t worry about the amount of change pictured, only about the inverse warming/cooling pattern. Quality, not quantity. For now. We’ll get to the ‘amount’ aspect soon enough, turning to Steps 2 and 3.)
Yes, we will soon get down to business, letting the data speak. First, though, I need to make you aware of one critical aspect of the difference between ENSO East and ENSO West. The one aspect that really makes ‘The Great Pacific Climate Shift’ so significant for ‘Global Step 1’ in mean temperature anomalies.
When the Pacific warm water follows its normal route through the tropics, from east to west, it is brought from the shallow surface layers of the East and Central Pacific and to a great extent stored at depth in the West, well away from the surface. This disparity is reflected in the thermocline depth. When the ENSO pendulum swings west (normal/neutral and cool conditions, La Niña), the east-west tilt in the thermocline is steep. When the ENSO pendulum swings east (warm conditions, El Niño), the tilt is flattened and warm water spills back from the west. The steeper the tropical thermocline (La Niña), the shallower it becomes in the East, making it easier for cold waters from below to well up, and at the same time, the deeper it dips in the west, making the WPWP thicker. So the tropical thermocline across the Pacific basin is either inclined from east to west (‘cool’ state) or it is close to flat (‘warm’ state). There is never a stable incline west-east. That’s why there can never be a warm-water storage to drain or refill in the East Pacific, only in the West. Once again, this natural setup is because of Earth’s rotation.
The WPWP mostly grows (thins) from the thermocline depth, meaning from the bottom down (up), not from the top (it also does vary in surface area, so a certain effect on surface anomalies is seen), while in the East, the surface is much more directly and thus strongly affected, because the thermocline depth here is significantly shallower and also doesn’t vary as much. From this, we can readily deduce that the West simply won’t warm (cool) anywhere near as much as the East will cool (warm). And this is also what the data shows. The two ENSO sectors are inversely related, but not at all proportionally.
This is an essential point. It’s the essential point. It is exactly why the world follows the East tropical Pacific surface anomalies up and down and not the West. Simply because the eastern ENSO amplitudes are so much larger. It is precisely why global temperatures correlate so well on a year-to-year basis with NINO3.4 SSTa and not with WPWP SSTa. If we were to use OHC (Ocean Heat Content) as the metric, moving from 2D to 3D temperatures, the overall picture would look very different indeed. But we will not. Not here, not now. Definitely later, in another post.
The crucial point is, what solar-heated (warm) water is being removed from the surface, can not cause the world to warm (meaning, from surface up). And this is what happens in the WPWP. I want you to get this: During normal and cool ENSO conditions, the solar-heated water is brought to the WPWP and stored at depth, away from the surface. During warm ENSO conditions (El Niño), the pendulum swings and the warm water is brought back east. But now the warm water is being pulled up (sloshes back) and spread out over the surface of the vast East tropical Pacific. This obvious contrast makes a huge difference. It makes all the difference. The normal range in anomalies between the trough (peak) of La Niña and the peak (trough) of El Niño is at least three times greater in the ‘ENSO East’ sector than in the ‘ENSO West’ sector. Over an area half again as large. This matters!
Returning now to the Stephens & Levitus paper referenced earlier, they here provide the clue to what ultimately came to pass in the wake of the 1976/77 climate shift:
“Figure 2(a-b) shows the temperature differences at selected standard depth levels (50m and 250m) for the 1978-88 period minus the 1964-76 period. These compositing periods were chosen to represent conditions before and after the mid-1970s shift. At 50m depth (…), a major feature in the temperature difference fields is the positive anomalies in the eastern Pacific associated with the [downward] displacement of the thermocline in this region. The post-1975 period shows an increase in temperature of as much as 1.5°C. (…) At 250m depth the western equatorial Pacific exhibits a cooling with a maximum difference of 1.2°C due to upward displacement of the thermocline.“
This, to me, is their most important find. Why?
Because it gives a direct reason for why total surface temperatures went up. Surface temps in the East Pacific rose en bloc with the flattening of the thermocline, but surface temps in the West Pacific did not similarly drop (Figure 14). What happened was simply this: The mean east-west tropical thermocline profile (the temp gradient) across the Pacific became less steep after the GPCS, meaning a permanent state was established where more of the solar-heated water stayed at or near the surface in the East – the tradewind-driven process bringing the solar-heated water from east to west became on average less efficient; weaker trades also lowered the wind shear across the ocean surface, diminishing mean evaporation rates:

Figure 8.
Take the exact progression of the two reanalysis curves (red and blue) with a pinch of salt. But the general picture here makes a lot of physical sense. A clear step-down in the east-west pressure differential across the tropical Pacific will very likely affect (weaken) the trades, which in turn will affect (weaken) the surface wind stress. And we all know how winds affect evaporation rates (latent heat flux from ocean to atmosphere).
The relatively swift change in Pacific warm-water distribution across the 1976/77 climate shift is clearly reflected in the data. It basically all manifests itself in the East.
Let’s have a go.
Where to begin? I’ll start by showing you just why what happens in the East Pacific matters. My defined ‘Real’ East Pacific sector only makes up about 25% of the global ocean. That’s one fourth. There is 75% left outside of it. 90 million square kilometres vs. 270. Still, the East Pacific rules the roost. Because of its immense range in SSTa:

Figure 9.
Note, the ‘Real’ East Pacific anomaly data here is downscaled by x0.25 while the ‘Rest’ is downscaled by x0.75, meaning the ‘Rest’ data is effectively three times that of the ‘Real’ E-Pac data. Still the latter matches and even ‘outdoes’ the former. It also appears to lead it by several months, six to be exact:

Figure 10.
There seems to be no evidence in the ‘Rest-of-the-world’ data of a general step up in the mean anomaly level post the 1976/77 shift. That lift evidently only occurs in the East Pacific data. Observe how flat the perceived trend in the ‘Rest’ curve is compared to the same in the ‘Real’ curve in Figure 9. This perception is verified statistically here:

Figure 11.
We will investigate this discrepancy a little further.
First, notice anything familiar about the ‘Real’ curve above? It very much resembles the NINO3.4 curve, doesn’t it? That’s no coincidence of course. The NINO3.4 region sits comfortably inside the much larger East Pacific basin, along the equator. Since 1970, the SSTa curves of the two correlate pretty tightly, a few small excursions here and there, but none of real consequence, they always end up back together after a short while … except at one particular instance:
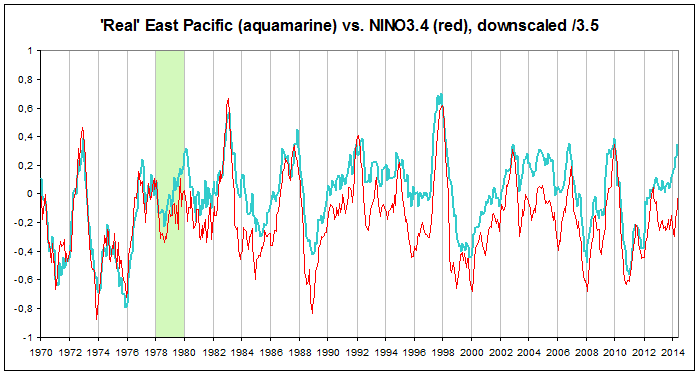
Animation 1.
In 1978/79 (green column), ‘Real’ East Pacific SST anomalies all of a sudden lift significantly relative to NINO3.4, and stay there, elevated, forever since. That’s the only permanent divergence between the two over the last 44 years. What we see, of course, is the establishment of the positive PDO (PDV) SSTa pattern in the East Pacific, manifesting itself already with the 1977-78 El Niño, but not really showing its worth until after. As you can see from the animation above, NINO3.4 tends to ‘catch up’ with the East Pacific during the El Niños even after 1976, but settles well below whenever ENSO conditions are neutral or cool. This is because the positive PDO SSTa pattern resembles the positive ENSO pattern (Figure 3) , but persists (outside the equatorial zone) even when ENSO is not in a real El Niño-like mode (Figure 4). Recalling the words of Mantua & Hare from 2002: “In the last two decades of the 20th Century, the extratropical Pacific Ocean was in an almost continuous El Niño-like state despite the absence of tropical El Niño events in a majority of those years. This situation, which originated with a strongly anomalous winter in 1976–1977, has been termed a “climatic regime”, following a regime shift in 1977.” Moreover, the words once again of Stephens & Levitus from 2001: “Overall, the analysis indicates the “regime shift” continues through 1998 with no signs of returning to a cooler phase.”
This is all supported directly by the data.
What if we were to compare NINO3.4 with the ‘Rest-of-the-world’ data?
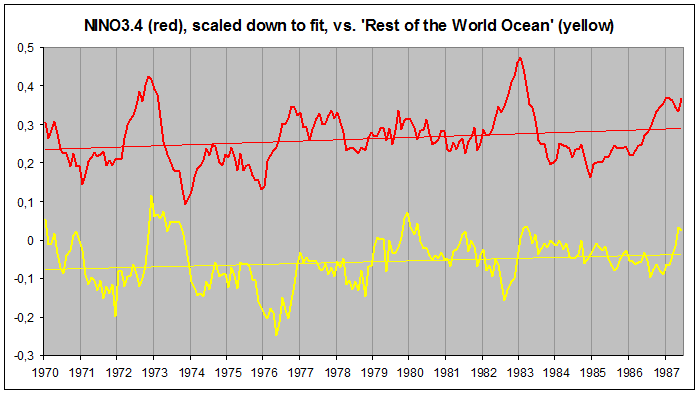
Figure 12.
Same 6 month ‘global’ lag as with the East Pacific. And no ‘global’ upward increase relative to NINO to be spotted. Here they are, directly superposed:

Figure 13.
What is very interesting here is knowing that baked into the ‘Rest-of-the-world’ data is the North Atlantic SSTa. The AMO (Atlantic Multidecadal Oscillation) cycle turned in 1977, just a few months after the Pacific shift. But we don’t see it properly reflected in global temperatures until we reach beyond this plot – from 1988 on. We will surely get back to this later, with Steps 2 and 3.

Figure 14.
Here, finally, is the ‘Real’ East Pacific vs. global (land+sea) temps from 1970 to 2014:

Figure 15.
One step down, two to go …

I have been following Okulaer and his alter egos for a long time on various blogs and discussion fora around cyberspace. For a long time I have been looking forward to the appearance of his blog. So far it really fulfills expectations. Finally I think we will get a presentation of the development of the climate over the last warming period, explaining this natural process based on observations, clean, rational, basic physics, logic reasoning and last, but not least the scientific method.
[…] We’ve already accounted for the 1979 global step (Step 1). It occurred as a direct result of the PDO (PDV) phase shift from a ‘negative’ (cool) to a ‘positive’ (warm) regime in 1976/77, as the East Pacific experienced a significant wholesale surface warming while the West Pacific did not similarly cool to offset that warming (“How the world really warmed …, Part II: Step 1″). […]